I did the data analysis and started writing this in 2009 (hence the selection of the data set), after a particularly annoying race experience, but never got around to publishing it at the time.
Every activity has its own rules of etiquette, which most people tend to pick up pretty quickly. Running is no different -- you shouldn't dart in front of cars or bicycles, if you're in a group you shouldn't block the whole trail, and when racing you should sort yourself by pace, faster runners up front and slow people in the back. Unfortunately, this etiquette is observed far less than it should. Go to any large race, and you'll undoubtedly be stuck behind some really slow people, unless you're at the very front of the pack yourself (in which case you're just as much a part of the problem unless you're planning to finish near the front of the pack as well.)
(Note: I do not write this to discourage novice or casual runners in any way. If you want to walk at a leisurely pace with your friends, that's wonderful. Just line up towards the back and you won't be in the way of those wanting to take a faster pace.)
By looking at some data, I want to better understand this phenomenon. My goals are twofold:
Below, I describe the development of a "rudeness index" (along with several alternatives) which can answer these questions. For example, the objectively rudest person in the race was someone who crossed the start line immediately after the race began, and ended up in 2796th place out of 2801 runners. A quick literature review doesn't turn up any other approaches to this problem, but if I've missed something I'm happy to cite it here.
To get data to work with, I took the finishing times from the 2008 Turkey Trot in Austin, TX, available here. I usually turn to Athlinks for race results in a standard format, but my approach needs both chip times and gun times, so I had to turn to the official results.
A few descriptive statistics: the 8K course had 2801 timed finishers; 1509 men and 1291 women. Age group statistics are as follows:
Note that I grouped all of the 60+ finishers together to keep each age group's sample sufficiently large (>50). This distribution seems typical of these "big event" type races which attract a wide cross-section of participants, and gives me confidence that this race is representative.
My basic assumption is that the order in which runners cross the start line should be very close to the order in which they cross the finish line. In fact, in an ideal world these orders would be exactly identical. To measure compliance with this standard, I use both the chip time and the gun time. Large races often report two times for each racer. Your chip time is the time elapsed between when you cross the starting line, and when you cross the finish line; your gun time is the time elapsed between when the first runners start, and when you cross the finish line. If you start far back in a large field, the difference between these times could be large.
Note that the gun time is at least as high as the chip time. In fact, you can calculate your "start" time (the time between the start of the race, and when you cross the start line) by subtracting your chip time from your gun time. By calculating this for each runner, and sorting them by their start times, you get the order in which runners crossed the starting line.
I will say that Runner A obstructs Runner B if Runner A has a higher chip time than Runner B, and a lower start time. This means Runner B had to pass Runner A on the race course, or equivalently, that Runner A should have started behind Runner B. A runner's finish rank is given by the order in which they crossed the finish line, as obtained directly from the gun time. A runner's start rank is given by the order in which they crossed the start line, as given by the difference between their gun time and chip time.
I propose three metrics for quantifying the rudeness of a particular runner:
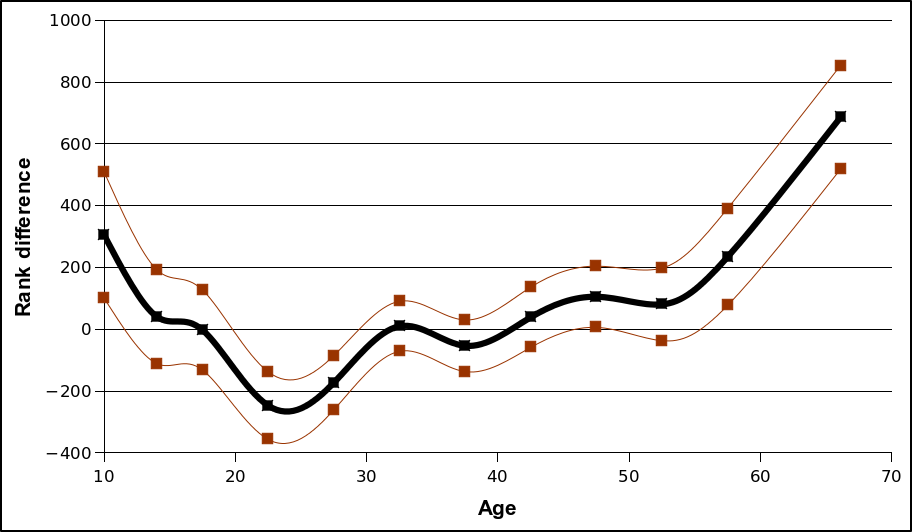
A few comments on these three metrics. Rank difference is unique in that it can be both positive and negative. A positive rank difference indicates rudeness: you finished further back in the pack than you started, so people had to pass you. A negative rank difference, on the other hand, means that you started further back than you could have (we can call this politeness). A zero rank difference means that the number of people you obstructed is exactly equal to the number of people who obstructed you.
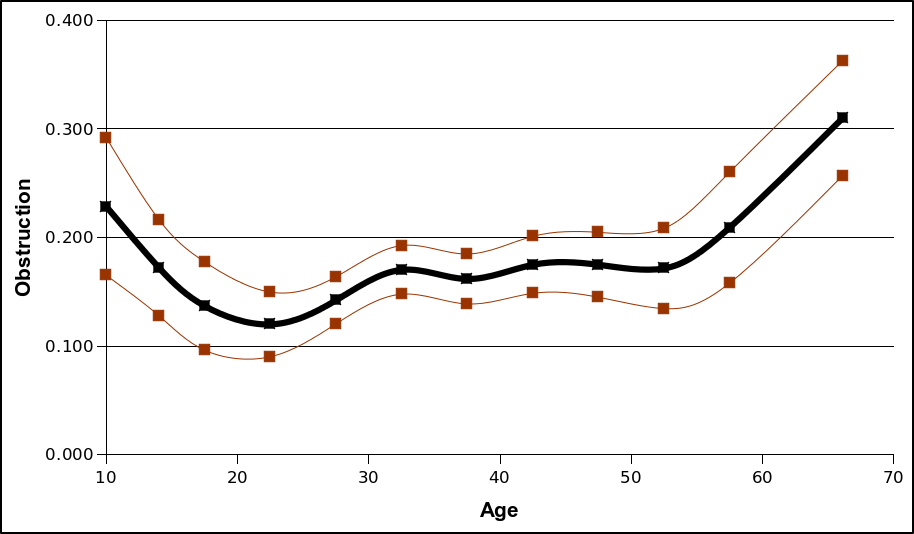
A shortcoming of rank difference is that it does not distinguish between someone who neither obstructs nor is obstructed (the ideal scenario), and someone who both obstructs and is obstructed by many people. Obstruction corrects for this, it is simply a measure of the proportion of people you obstructed without any way to make up for it by having others obstruct you in return. Obstruction is always between zero (you obstructed nobody) and one (you obstructed literally everybody else in the race, i.e. you crossed the start line first and the finish line last).
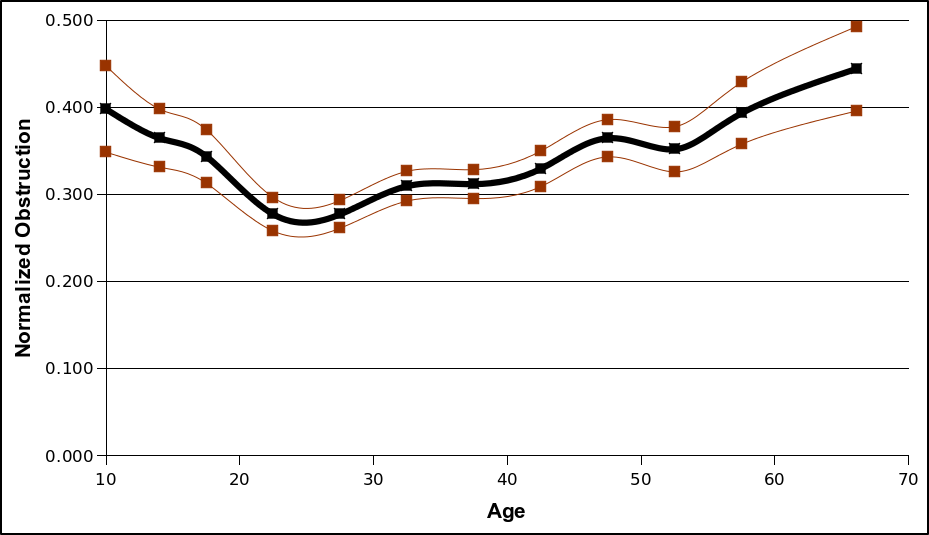
The normalized obstruction attempts to correct for a runner's speed. Let's say your finish rank is 100. There is no way you could have obstructed more than 99 runners: by the definition of obstruction, it is impossible for you to have obstructed anyone in 101st place or later. This puts an upper bound on your obstruction value. The normalized obstruction tells you what proportion of runners you obstructed, excluding anybody it was impossible for you to obstruct by virtue of finishing first. So, if your start rank was 1 and your finish rank was 100, your obstruction is 99/2800 = 0.035 (a small value) but your normalized obstruction is 99/99 = 1, indicating that you still managed to obstruct everyone you possibly could have.
I will demonstrate these using myself as an example. My chip time was 34:34, and my gun time was 35:15, meaning that I crossed the start line 41 seconds after the start of the race. This corresponds to a start rank of 521 and a finish rank of 207. By looking at the race results, there were 33 runners with a start time greater than 41 seconds, but a chip time of less than 34:34 -- this is the number of runners who should have been in front of me rather than behind me at the start of the race. My rank difference is -314 (207 minus 521), my obstruction is 0.012 (33 divided by 2800), and my normalized obstruction is 0.16 (33 divided by 206). I passed 314 more runners than runners passed me; I obstructed 1.2 percent of all runners in the race, but 16 percent of the runners who were faster than me.
As another example, the rudest person in the race (by all of these measures) had an identical chip and gun time of 1:35:20. This means that they started the race at the very front of the pack (start rank tied for first with everyone who crossed the start line in the first second), and finished in 2796th place (5th from last). Their rank difference is -2795, their obstruction was 0.993 (that is, 99.3 percent of all the runners had to pass this person), and their normalized obstruction 0.991. Incidentally, two of the five people who were even slower also crossed the start line within the first 20 seconds of the race. This is kind of ridiculous.
To start, I calculated these statistics by gender and age group. Lower numbers are better for all of these metrics. Below the table and the plots, I do some statistical analysis. If you want to skip over the analysis, you can jump to the conclusions at the end.
| Group | n | Rank difference | Obstruction | Normalized obstruction |
|---|---|---|---|---|
| Male | 1509 | −161 | 0.130 | 0.304 |
| Female | 1291 | +188 | 0.210 | 0.342 |
| Age 1-12 | 71 | +304 | 0.228 | 0.398 |
| Age 13-15 | 112 | +41 | 0.172 | 0.365 |
| Age 16-19 | 118 | −3 | 0.137 | 0.343 |
| Age 20-24 | 205 | −248 | 0.120 | 0.277 |
| Age 25-29 | 362 | −173 | 0.142 | 0.277 |
| Age 30-34 | 415 | +9 | 0.170 | 0.310 |
| Age 35-39 | 379 | −54 | 0.162 | 0.312 |
| Age 40-44 | 267 | +39 | 0.175 | 0.329 |
| Age 45-49 | 226 | +105 | 0.175 | 0.365 |
| Age 50-54 | 164 | +80 | 0.172 | 0.352 |
| Age 55-59 | 97 | +234 | 0.209 | 0.393 |
| Age 60+ | 81 | +686 | 0.310 | 0.444 |
I've also included plots of the three rudeness metrics showing correlations with age. The thick blue line shows the average values, while the red lines show the 95% confidence band.
A few general observations. First, women score higher than men on all three obstruction indices. I have not reported standard deviations in the tables above (for reasons of space), but for those with a bit of statistics knowledge we can use these to run some tests of statistical significance. The sample standard deviations for the three metrics are 831, 0.186, and 0.231for men and 798, 0.150, and 0.230 for women. These look high, but the large sample sizes save the day. We can test the null hypothesis that men and women are equally guilty of obstruction by using an unpaired two-sample t-test for equal means. The resulting t-scores for the three metrics are 11.3, 12.5, and 4.29 --- very strong evidence that on average, women obstruct more runners than men.
But do notice that much of this effect has to do with overall speed, and that a good chunk of the difference disappears when looking at the normalized obstruction. Since men tend to be faster than women, a typical man has fewer opportunities to obstruct other runners than a typical woman. But even the normalized obstruction shows a significant difference (a t-score of 4.29 roughly corresponds to a confidence level of 99.998%), so there's something more at work.
There seem to be significant age effects as well. Look at the confidence interval plots above, it's pretty clear that rudeness (by all measures) is highest for the youngest and oldest runners. Normalized obstruction seems to provide the clearest trends (narrowest confidence band), so even after accounting for overall speed it seems like young adults (late teens to 30s) obstruct the least runners.
Based on the three measures I've defined, it seems that men obstruct fewer runners than women, and that young adults obstruct fewer runners than younger or older participants. It remains to explain why this happens. I don't have solid evidence for this, only speculation. One possibility is that perhaps some mixed-gender or mixed-age groups of runners choose to start together, but later separate according to pace. This would make the faster runners in the group less obstructive, and the slower runners in the group more obstructive, naturally favoring men and young adults who tend to have the fastest times. By choosing to start together, they are prioritizing cameraderie over politeness.
Another possible explanation has to do with running experience -- perhaps those who are slower runners are also less aware of the norms and etiquette of racing. This is related to the Dunning-Kruger effect, which applied here would suggest that the better the runner you are, the better you are able to assess where you should be in the starting pen by comparing your ability to those around you. The flip side is that less experienced runners are less able to do so, and more likely to end up in the wrong place. Or they are less likely to even know about this etiquette in the first place.
I'm happy to hear other interpretations or explanations from readers. In any case, more research is needed to see if these trends hold true across other races, or with other definitions of obstruction.